We can gather CPU used by an Oracle database from several sources. Within Oracle it can come from instrumentation and sampling active sessions. At the OS level we can use tools provided by the operating system.
For an Oracle database running on AIX with POWER type processor CPU usage from instrumentation represents core capacity used. That is what shows up as ‘DB CPU’ in AWR reports. That is what we see in OEM with dark green color as ‘CPU’.
Another way to track CPU is from active session history (ASH) filtered on status ‘ON CPU’. ASH will capture sessions’ time running on logical CPUs. It should match CPU numbers from instrumentation unless processes can’t get enough CPU resource. In OEM grid control ASH data is used to calculate the light green ‘CPU WAIT’ on the Average Active Session graph.
So there are two ways to express the same CPU usage: the 1st is core capacity used, the 2nd is time spent on logical CPU.
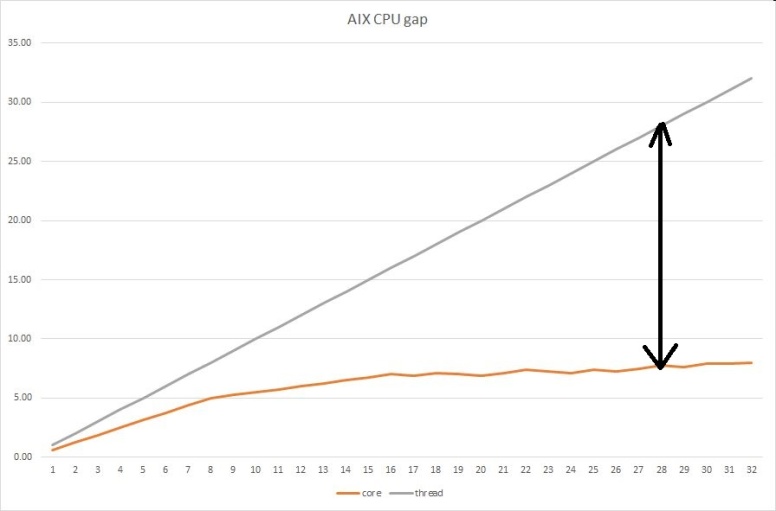
For Oracle an lpar with 8 cores has 8 seconds of CPU capacity for each wall clock second. But AIX thinks the lpar has 32 (logical) CPUs with 32 seconds of CPU resource… Oracle’s CPU usage is underreported on the machine.
I think of the difference between the two numbers representing the same CPU usage as the “AIX CPU gap”.
Core and thread based CPU utilizations also differ. I call the difference between the two utilizations the “AIX Utilization Gap”.
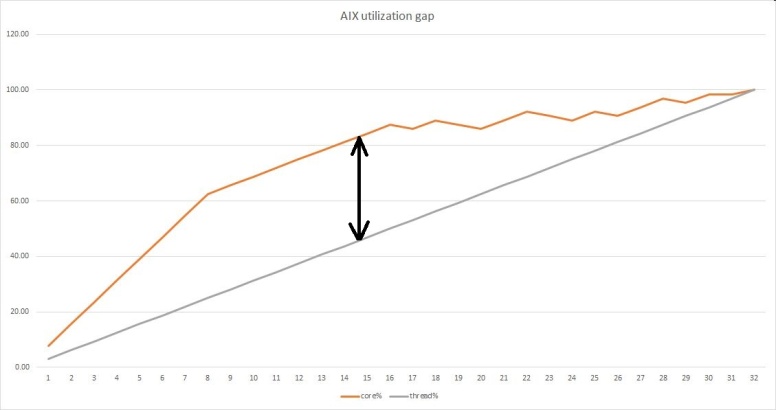
I calculated the gaps for both POWER7 and POWER8 processors, see ‘utilization’ sheets in power7.xls and power8.xls.
Our production DB is running on POWER8. In the AWR report I posted in My database is slow, now what? the OS had 43% CPU utilization for a slow day. I felt something was off. Now I know we were running at around 88% of the lpar-s core capacity.
Per Understanding CPU on AIX Power SMT Systems “I’ve heard one person say that they always double the CPU numbers in AWR reports for AIX/SMT systems. It’s a stab in the dark but perhaps useful to remember.”
Instead of guessing we can look up the chart to have a better understanding of CPU consumed by the machine or the database. It is good to know–also helps paying the bill if you are a contractor–you are close to being maxed out on CPU.
Request for help…if you are a math wiz… is there a way to create a formula between columns %core and %thread in my excel utilization sheet? Such formula would help DBAs to convert underreported OS CPU utilization to core based utilization.
Another request…if you are an Oracle or AIX wiz…do you (dis)agree?
Enough theory, let’s gather some evidence. That is coming next.
