The more I look at it, the more puzzling it gets. I can’t match DB CPU utilization numbers with what the OS is showing. At the same time I know that the DB is the biggest user of the machine.
For the OS we gathered OS CPU utilization data from AWR’s v$osstat (and its sysmetric equivalent) and also from OEM (Oracle Enterprise Manager). Based on these sources, OS CPU utilization remained relatively low – it was 43% busy on our slow day (4/27). With 128 CPUs that equals to around 50 CPU seconds used for each wall clock second.
At the same time we experienced a big jump in parse related CPU utilization pushing DB CPU use to around 10 CPU seconds for each second.
All of this while batches ran longer and users complained about DB slowness.
Around this time into the investigation, the system administrators revealed that the machine used all available CPU during our slow week; they are showing nmon data to prove the point.
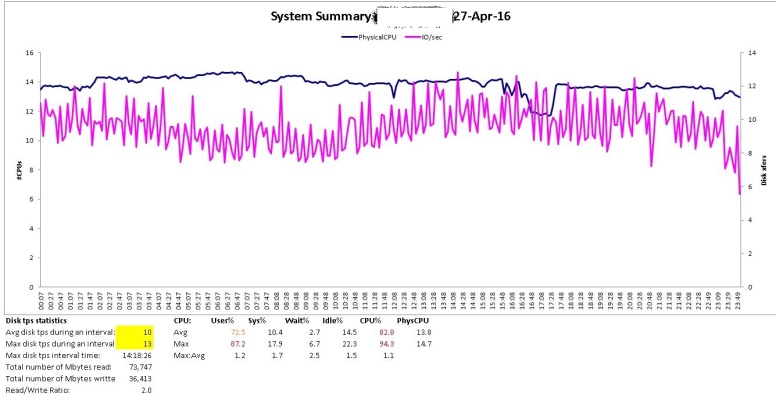 nmon_cpu_0427.jpg
The upper blue line shows that the machine is using around 14 CPUs the whole day.
Up until now I had a feeling the system was under pressure (it had higher load from hard parse), but did not think we are CPU constrained based on the available CPU capacity of the machine. Knowing/thinking we are bottlenecked on CPU changes everything.
This is a completely new situation, it can explain the ballooned parse time elapsed and the increase in ‘db file sequential read’ wait time.
During this phase of my research these articles were helping me to learn more about how CPU is used & accounted for in Oracle:
What Really Is That Light-Green Oracle Database CPU Wait Time?
AWR reports: interpreting CPU usage
CPU Wait? LAG to the Rescue
We still have a discrepancy for the OS CPU utilization between nmon data presented by sysadmins and OEM/AWR data DBA’s are relying on…read on!
