In previous post I narrowed down the root cause to hard parsing. In this post we will track down the hard parsing sqls.
AWR report (and DBA_HIST_SQLSTAT) may not have such information, each sql may execute only once (or few times), they are not big enough to make it into AWR.
But ASH report’s “Top SQL using literals” section showed two FORCE_MATCHING_SIGNATUREs (FMS) with many sql versions. The DB was executing the same sqls different only in literals passed in.
We can also find those FMSs using custom scripts, see how I do that in rootcause.txt. There are 2 FMSs with distinct sql counts of 90+ thousand on 4/27. They started to show up around 4/23, same time when parse CPU shut up.
We can also find parse related information in ASH. We can even calculate time spent on logical CPUs for parsing. ASH also has session count, account used, the application connecting, the machine initiating the connections, etc… a gold mine of information. With such detail we can track down the source parsing sqls executed from.
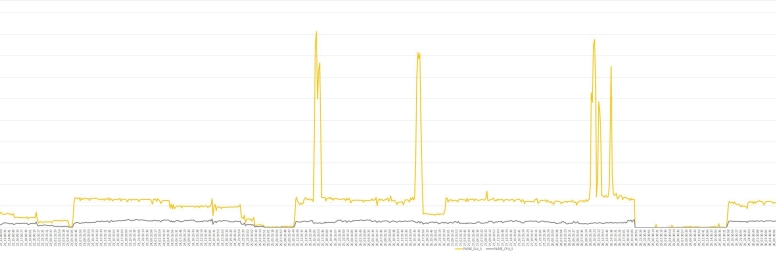
Let’s look at how parse CPU from the 2 FMSs compare with CPU used for all parses and CPU used for all the sqls in sqlstat. Please see query “–parse_cpu_fms” in rootcause.txt.
Data points are also listed in “rootcause” sheet of mining_awr.xlsx or you can zoom in
parse_cpu_fms.jpg
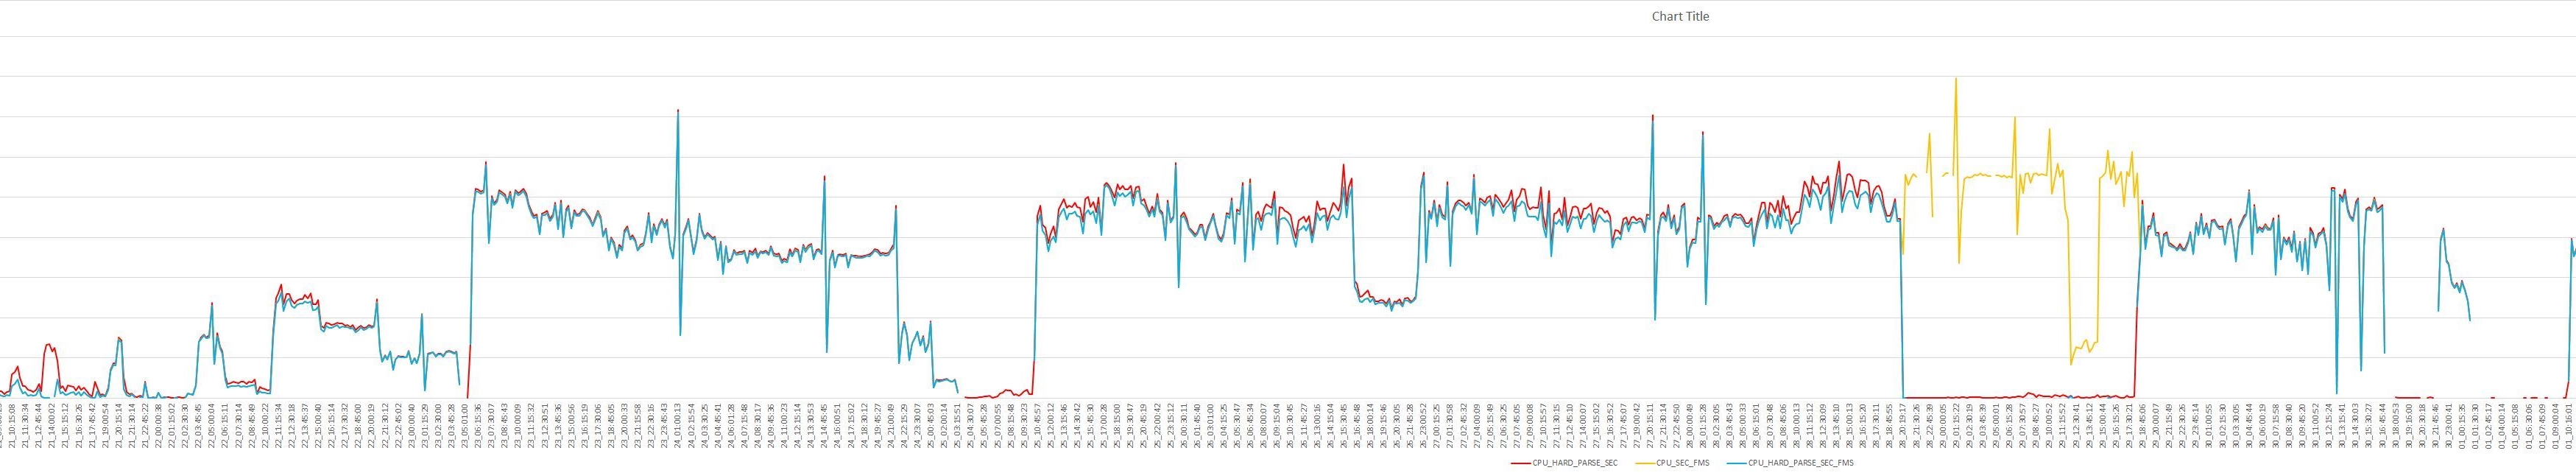
CPU_HARD_PARSE_SEC	ASH session_state='ON CPU' and IN_HARD_PARSE='Y'
CPU_SEC_FMS		ASH session_state='ON CPU' for the 2 FMSs
CPU_HARD_PARSE_SEC_FMS	ASH session_state='ON CPU' and IN_HARD_PARSE='Y' for the 2 FMSs
Most of the DB hard parse CPU (CPU_HARD_PARSE_SEC) came from hard parsing the sqls with the 2 FMSs (CPU_HARD_PARSE_SEC_FMS). The sqls with literals used most of the CPU for parsing since the CPU used during FMSs execution (CPU_SEC_FMS) is the same as CPU_HARD_PARSE_SEC_FMS.
For some reason 4/29 was different. That day parse related CPU usage disappeared, instead CPU was used for executing the sqls with FMSs (CPU_SEC_FMS, yellow line). Any guesses what happened that day? I may write about this in the future.
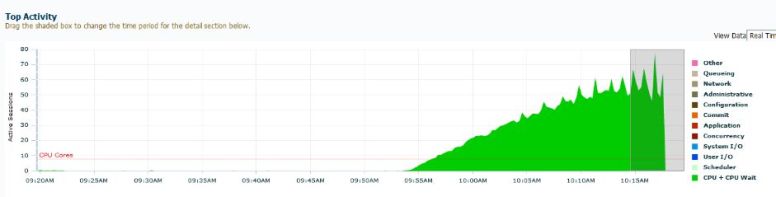
According to ASH we had 30 sessions executing the 2 FMSs. The sessions were connected from 4 machines, please see query “–parsing_sessions” in rootcause.txt. In my previous post Are we maxed on CPU? we saw OS load increased by 30 on slow day, these are the sessions responsible for the load increase.
During the execution of sqls related to the 2 FMSs the sessions were constantly hard parsing. That is a CPU intensive task, see query “–session_state by FORCE_MATCHING_SIGNATURE”.
FORCE_MATCHING_SIGNATURE SESSION EVENT                          I I TOTAL_TIME        CPU    WAITING
------------------------ ------- ------------------------------ - - ---------- ---------- ----------
    10458055140908993565 ON CPU                                 N N      59000      59000          0 batch related
    17710121666287808037 ON CPU                                 Y Y      47000      47000          0 hard parsing FMS
     6747409576012680712 ON CPU                                 Y Y      44270      44270          0 hard parsing FMS
      201958791624409026 ON CPU                                 N N      11100      11100          0
    16583812627080328788 WAITING db file sequential read        N N      13210          0      13210
     1409798687556705245 WAITING read by other session          N N      52440          0      524400
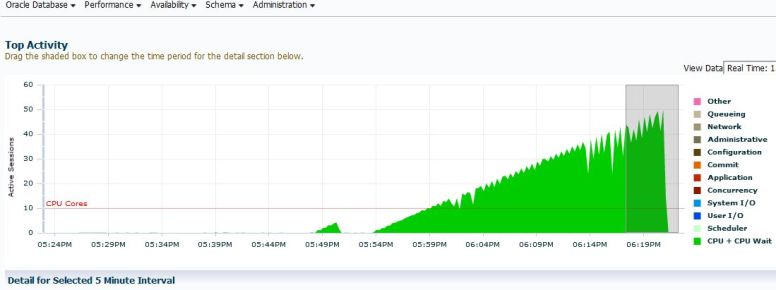
Hard parsing sessions together with the sqls in batch increased CPU usage up until DB used all core capacity available to the lpar.
I am declaring hard parsing of sqls with literals as the root cause.
During my discovery I did a lot of research on (hard) parsing, it is no accident you will see parse_hard & parse_soft hog types in my load testing “hog” script. In a future post I may demonstrate how to generate (and catch) a parse heavy DB load.
At the beginning of my research I ruled out parsing:
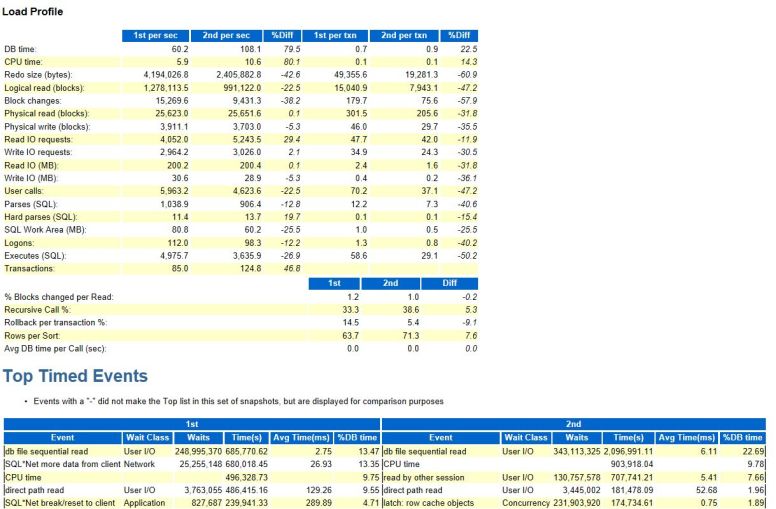
– number of parses (soft and hard) did not change a lot, soft parse decreased by 12%, hard parse increased by 19%
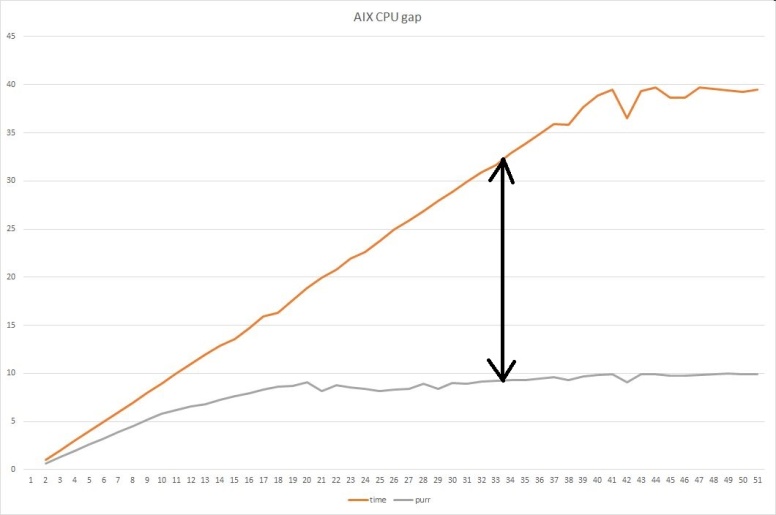
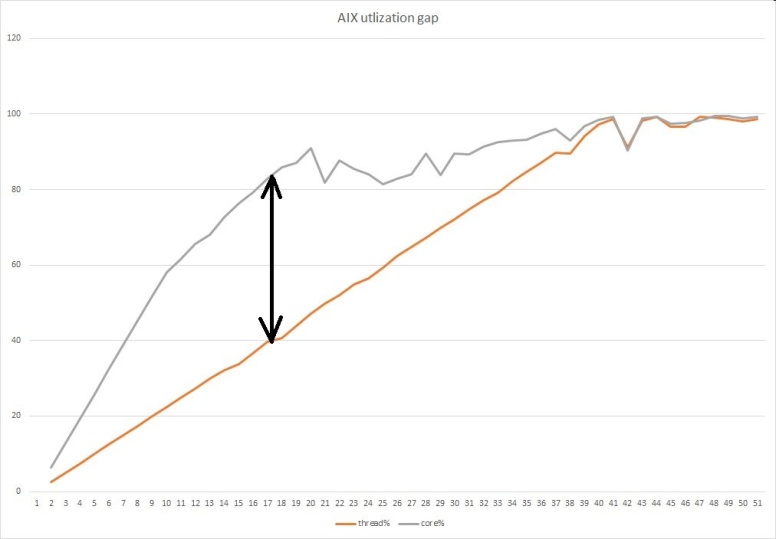
– the machine was running with around 40% CPU utilization on slow week. I was thinking we have plenty of unused CPU capacity
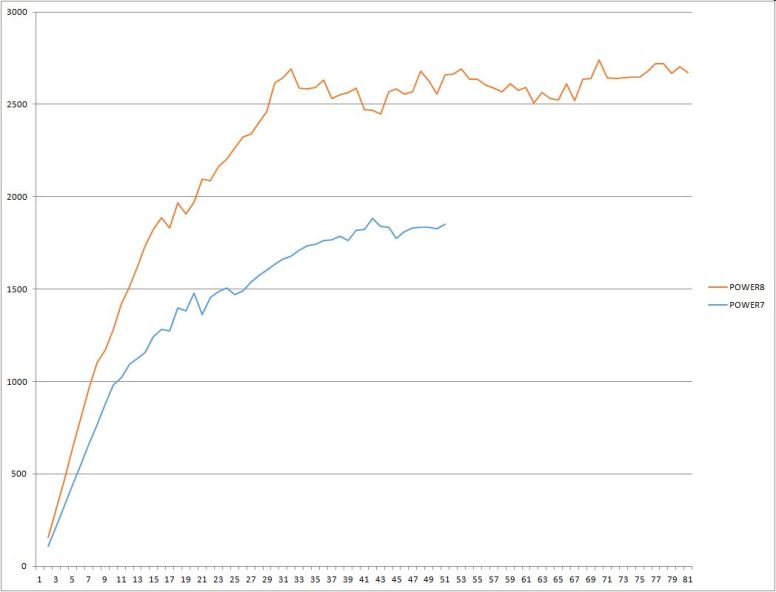
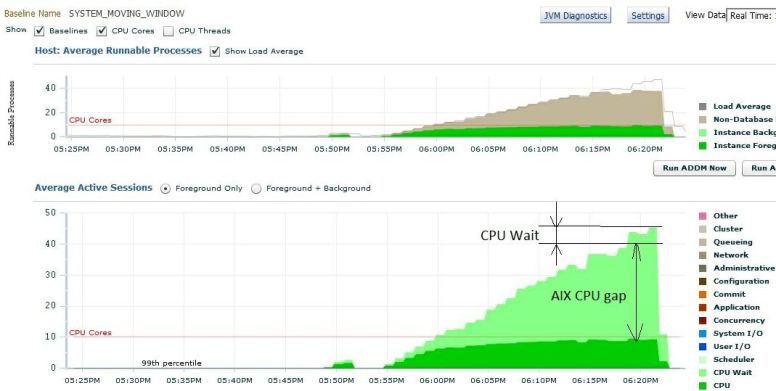
I was wrong. Even without batches the load was around 60 on a machine with 128 logical CPUs/threads. On POWER8 that translates to close to 90% core utilization while the OS thinks CPU is around 50% utilized. Therefore CPU utilization was under reported, it was misleading.
But it gets worse, the lpar was not able to get full cores for all 16 virtual processors, only around 14 cores were available from shared CPU pool, so we were utilized beyond 90% on core capacity available to the lpar.
How is it possible that such a small change in number of hard parses maxed out the CPUs?
The extra 200 thousand hard parse on slow day showed up as an increase of 11.4 to 13.7 hard parses per second, does not look that much, right?
Turns out not the number of hard parses but the type of sql we parsed was the problem. I won’t post the sql to protect the innocent. Each sql was a complex 20K long sql, the DB processed close to 200 thousand per day on our slow week.
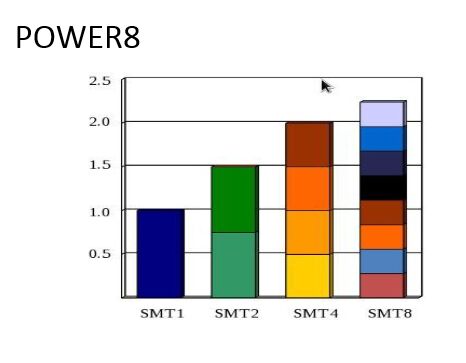
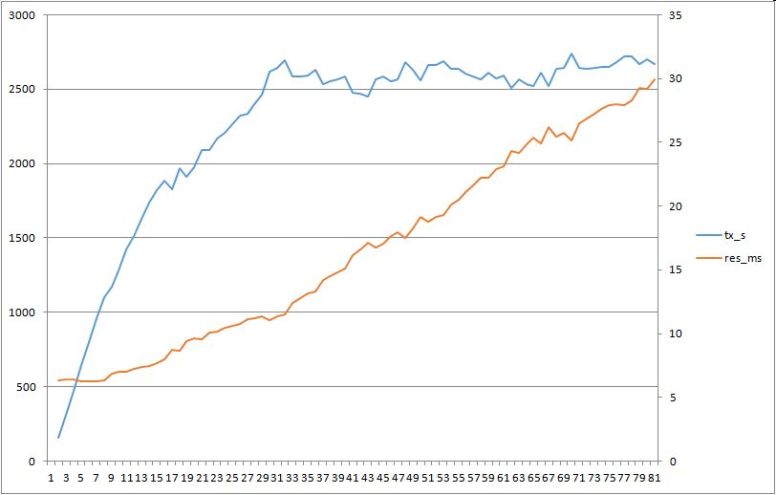
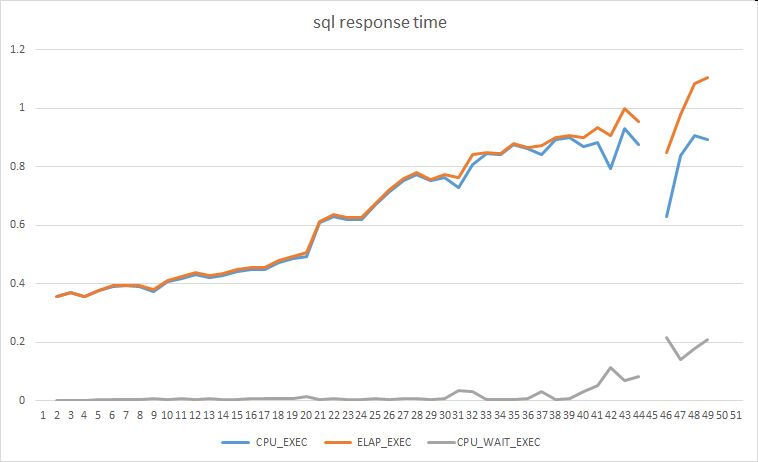
On our slow week on top of normal DB activity and the overnight batches an application started to bomb the DB with those complex sql-s with literals. The 30 hard parsing sessions increased the load on the machine. POWER8 processor turned on more threads to accommodate the load. Oracle sessions (sqls in those sessions) had slower response time due to POWER8 processor was running with higher SMT.
The 2nd biggest DB Time increase (after ‘hard parse elapsed’) came from waits on ‘db file sequential read’. A machine with CPU starvation can serve disk requests slower especially when data is coming from cache/memory. See case study CPU starvation disguised as an I/O issue (yet another AWR case study) by Savvinov with similar scenario.
During my analysis I got distracted a bit by the intricacies of AIX/POWER. I wasted some time on dead ends. I also learned a lot along the way. Hope you will benefit and your next root cause analysis can conclude in days instead of months.
An abbreviated version of my experience is available in powerpoint format, Oracle on aix v4.pptx.